Every engineer has been there. You fire up your local development environment, only to discover that port 3000, 8080 or 5432 is already taken. A quick lsof or netstat spits out a PID, but it tells you nothing useful. Is that a leftover Next.js dev server from last week’s branch? A forgotten Docker container? Or worse, a zombie process quietly consuming resources? Hours slip away as you hunt through terminals, kill processes blindly, and pray nothing important breaks. This friction is not a minor annoyance; it is a daily tax on productivity.
That frustration was the catalyst for PortForge.
The Spark: Why I Built It
Like many engineers, I grew tired of tools that stopped at the surface. Traditional port scanners deliver raw data; process IDs, basic names, but they ignore the context that actually matters in modern development. I wanted something that understood my workflow: which framework was running, what Git branch it belonged to, whether it was healthy, and if it was safe to shut down. PortForge was born from that gap. Built entirely in Rust, it delivers a single static binary that answers not just “what is listening?” but “why is it listening, and what should I do about it?”
The goal was never to replace ss or lsof. It was to augment them with the engineering intelligence developers actually need.
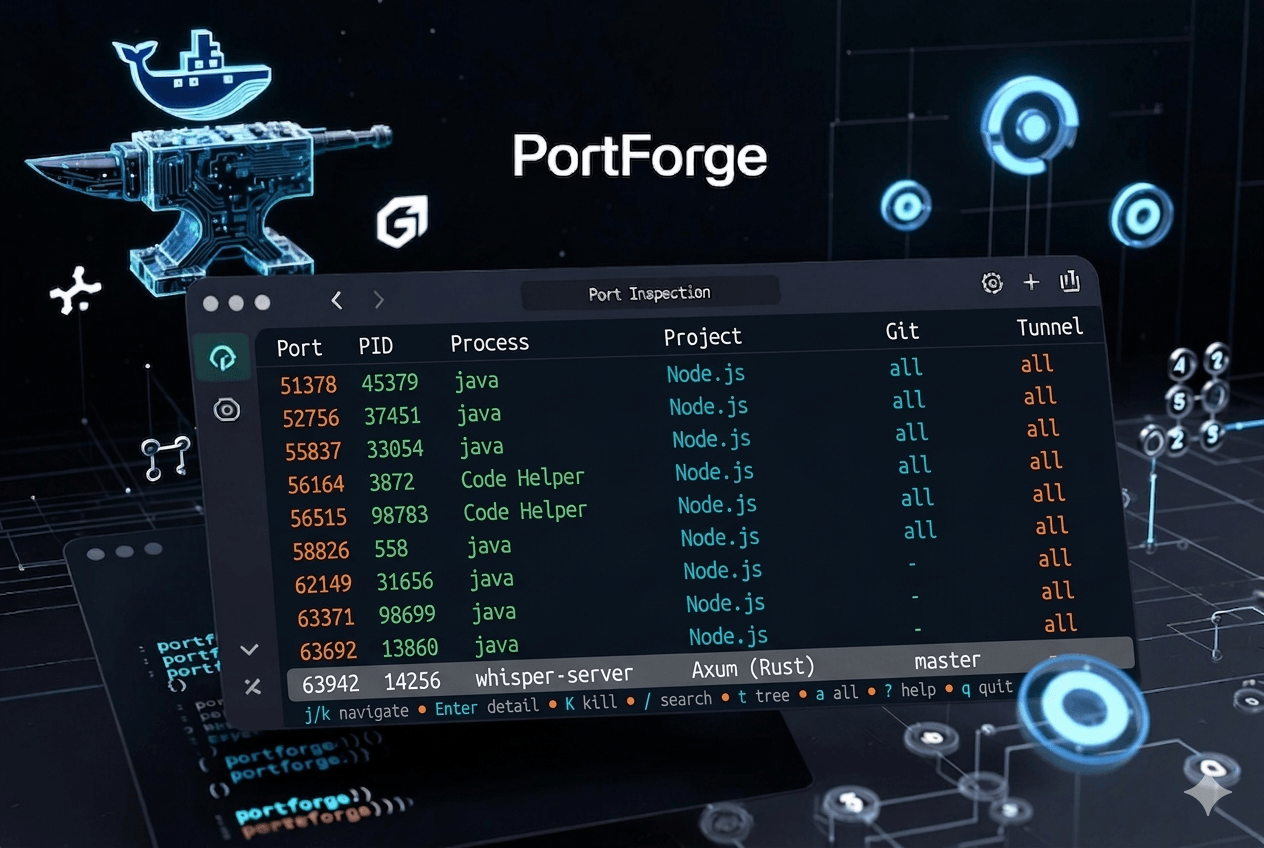
Meet PortForge: Instant Visibility with Developer Context
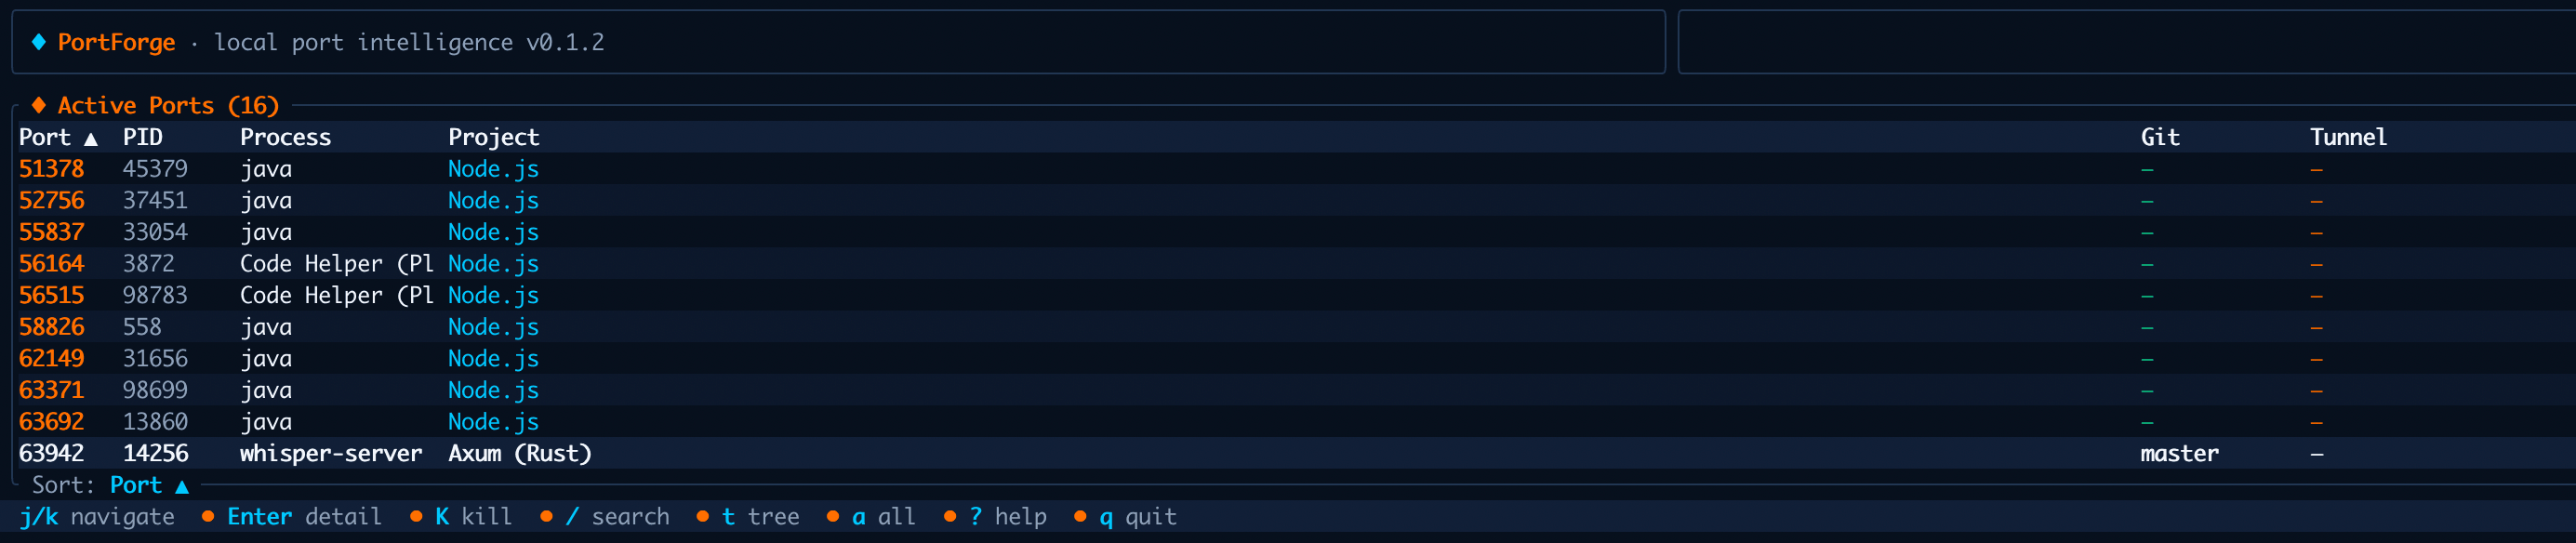
PortForge is a cross-platform port inspector and manager designed specifically for local development. It maps every listening port to rich, actionable context: process ownership, framework detection, Git state, Docker container links, HTTP health status, resource usage, and process hierarchy. All of it surfaces in under 50 ms on a cold start, thanks to a lean Rust core and a polished terminal-first design.
At its heart is a terminal user interface (TUI) powered by Ratatui, complete with Vim-style keybindings for rapid navigation. For those who prefer a visual overview, an optional Axum- and HTMX-powered web dashboard can be enabled at build time. Whether you are triaging ports in a hurry or exploring a complex microservices setup, PortForge gives you clarity without ceremony.
Learn more at kabudu.github.io/portforge.
Features That Deliver Real Engineering Value
PortForge stands apart through deliberate, opinionated features that address actual pain points:
- Framework and project awareness: over 20 language detectors and 40+ framework heuristics automatically identify what is running, from Next.js and FastAPI to Django and beyond, and tie it back to the repository.
- Git and Docker integration: see the current branch, dirty status, and native mappings to Docker or Podman containers via the Bollard API.
- Health intelligence: framework-aware HTTP probes, with configurable endpoints and timeouts, confirm whether a service is truly serving traffic.
- Resource visibility: CPU, memory, and uptime metrics help spot runaway processes or duplicate instances.
- Safe cleanup workflows: orphan and zombie detection, dry-run previews, and one-click termination reduce the risk of accidental disruption.
- Flexible output: JSON, CSV, and formatted tables work well for automation, while the interactive TUI stays optimized for fast manual inspection.
These are not afterthoughts; they are the result of building for real development machines crowded with multiple projects, containers, and background services.

Under the Hood: A Rust-First Architecture
Choosing Rust was deliberate. It delivers memory safety, lightning-fast performance, and true cross-platform binaries with zero runtime dependencies; essential for a tool that must feel native on macOS, Linux, and Windows alike.
The codebase is deliberately modular:
- The listeners crate provides efficient port-to-PID mapping.
- sysinfo supplies process trees, metrics, and hierarchy.
- Custom logic in
project.rsapplies heuristics to detect frameworks and languages. - git2 reads repository state.
- bollard handles Docker and Podman container metadata.
health.rsperforms targeted HTTP probes with sensible defaults per framework.
Configuration lives in a clean TOML file at ~/.config/portforge.toml, supporting per-port overrides, custom health endpoints, and theme preferences. Export logic, error handling with thiserror, and the Ratatui-based TUI live in dedicated modules, keeping the core scanner focused and testable.
The result is a tool that is small (around 5-8 MB), blazingly fast, and extensible. Every line was written with the same engineering context it aims to provide.
Getting Started in Moments
Installation could not be simpler for Rust users:
cargo install portforgePre-built binaries are also available on the GitHub releases page for those who prefer a one-step download. Once installed, portforge launches the TUI immediately. Useful commands include:
portforge inspect 3000for a deep dive on a specific port.portforge clean --dry-runto preview safe cleanup.portforge ps --jsonfor structured data in scripts.portforge serveto spin up the browser dashboard when built with the web feature.
Full documentation, including keybindings and configuration examples, lives on the project website.
Try it today at kabudu.github.io/portforge.
Open Source by Design
PortForge is released under the MIT license and lives at github.com/kabudu/portforge. The repository includes a clear roadmap, contribution guidelines, and integration tests. I built it to solve my own problems, but I hope it solves yours too. Issues, feature requests, and pull requests are warmly welcomed, whether you want to expand framework detection, improve the web dashboard, or simply share how it fits into your workflow.
Context Changes Everything
In the end, PortForge is more than a port scanner. It is a small but deliberate step toward development environments that respect the engineer’s time and mental model. By surfacing the why behind every listening port, it turns opaque system noise into actionable insight.
If you have ever lost an afternoon to port conflicts, I invite you to install PortForge, run it once, and feel the difference. The tool is ready; the only missing piece is your feedback and contributions.
Here is to clearer ports, fewer surprises, and more time spent building what matters.